> ## Documentation Index
> Fetch the complete documentation index at: https://io.net/docs/llms.txt
> Use this file to discover all available pages before exploring further.
# Monitor & Manage Clusters
> Manage Clusters offers a comprehensive interface for configuring and monitoring GPU and CPU clusters, enabling users to optimize resource allocation and performance. With advanced management tools, users can efficiently deploy workloads, scale resources, and gain real-time insights into cluster health and utilization.
To access the dashboard, log into [io.net](http://io.net) and select **Manager Clusters**.
## View Your Cluster
To see all the details about your cluster, click on it in the **Cluster** tab. The screenshot below highlights what you can expect to see in a hired, active cluster.
 #### Clusters Tab
The **Clusters** tab provides a quick overview of all your clusters, both active and inactive.
#### Sort Clusters
Use the sorting options to find the cluster you're looking for easily. Sort by status (**Running, Completed, Failed, Destroyed**) or search by keyword.
#### Clusters Tab
The **Clusters** tab provides a quick overview of all your clusters, both active and inactive.
#### Sort Clusters
Use the sorting options to find the cluster you're looking for easily. Sort by status (**Running, Completed, Failed, Destroyed**) or search by keyword.
 ## Cluster Management Actions
These actions can be done if a cluster is currently running.
#### Terminate Cluster
Click **Terminate Cluster** in the bottom right to end your session.
## Cluster Management Actions
These actions can be done if a cluster is currently running.
#### Terminate Cluster
Click **Terminate Cluster** in the bottom right to end your session.
 #### Extend Cluster
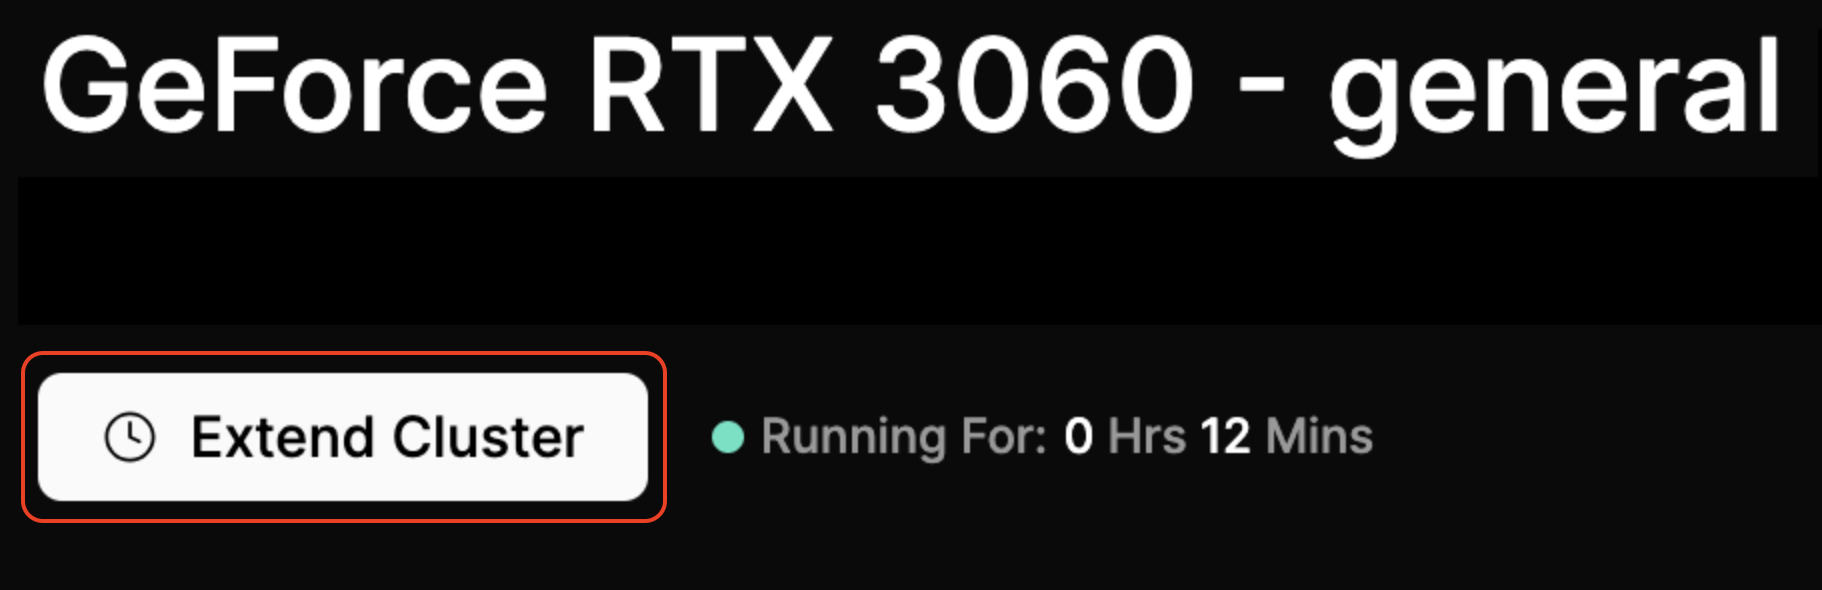
To keep your cluster active for longer, simply click **Extend Cluster**. You'll be charged the same amount as your original transaction.
#### Extend Cluster
To keep your cluster active for longer, simply click **Extend Cluster**. You'll be charged the same amount as your original transaction.
 ## Actions
A completed cluster provides the option to archive the cluster. Click **Archive** in the bottom right to archive this cluster.
**Run Jobs and Monitor Your Cluster**
Ready to start working on your cluster? You can run your jobs using either Visual Studio or Jupyter Notebook. The Ray Dashboard lets you manage and monitor everything, including your cluster and running jobs.
On your cluster's details page, grab the **IDE Password**, and then click on **Jupyter Notebook**, **Visual Studio**, or the **Ray Dashboard** to get started
## Actions
A completed cluster provides the option to archive the cluster. Click **Archive** in the bottom right to archive this cluster.
**Run Jobs and Monitor Your Cluster**
Ready to start working on your cluster? You can run your jobs using either Visual Studio or Jupyter Notebook. The Ray Dashboard lets you manage and monitor everything, including your cluster and running jobs.
On your cluster's details page, grab the **IDE Password**, and then click on **Jupyter Notebook**, **Visual Studio**, or the **Ray Dashboard** to get started
 To access your application, enter the **IDE Password**.
Once your cluster's time expires, you'll lose access to the IDEs and the Ray Dashboard.
#### Archive a Cluster
Once a cluster is complete, you can archive it. Click **Archive** at the bottom right to archive a cluster.
> 🚧 You can’t renew a cluster after it’s completed.
## Cluster Information
Click on a cluster in the **Cluster** tab to view the details associated with the cluster. In the screenshot below, a completed cluster has been selected.
To access your application, enter the **IDE Password**.
Once your cluster's time expires, you'll lose access to the IDEs and the Ray Dashboard.
#### Archive a Cluster
Once a cluster is complete, you can archive it. Click **Archive** at the bottom right to archive a cluster.
> 🚧 You can’t renew a cluster after it’s completed.
## Cluster Information
Click on a cluster in the **Cluster** tab to view the details associated with the cluster. In the screenshot below, a completed cluster has been selected.
 ## Monitor the following on the right:
| Action | Description |
| -------------------------- | ------------------------------------------------------------------------------------------------------------------- |
| **Compute Hours** | Shows how long a single instance has been running and consuming resources. Includes “Served” and “Remaining” times. |
| **Funds Used or Refunded** | The amount you've spent or had refunded for cluster operations. |
| **Connectivity Tier** | Your chosen level of connectivity for the cluster (download / upload speeds). |
| **Security Compliance** | The selected security setting (e.g. end-to-end encryption). |
| **Locations** | Geographic location(s) where your GPUs are located. |
## Monitor the following on the right:
| Action | Description |
| -------------------------- | ------------------------------------------------------------------------------------------------------------------- |
| **Compute Hours** | Shows how long a single instance has been running and consuming resources. Includes “Served” and “Remaining” times. |
| **Funds Used or Refunded** | The amount you've spent or had refunded for cluster operations. |
| **Connectivity Tier** | Your chosen level of connectivity for the cluster (download / upload speeds). |
| **Security Compliance** | The selected security setting (e.g. end-to-end encryption). |
| **Locations** | Geographic location(s) where your GPUs are located. |
 ## Monitor the following on the left:
| Action | Definition |
| ---------------- | ------------------------------------------------------------------------------------------------------------------------------------------------------------------------------------------------------------------ |
| **All Workers** | Allows you to filter the view by selecting different groups of workers. This option is currently set to show all workers in the cluster. |
| **\[#] Workers** | Indicates that the dashboard currently shows four workers in the cluster that are active or relevant to the task being monitored. The panel below labels these workers as "IO Worker 1," "IO Worker 2," and so on. |
| **\[#] GPUs** | Shows that there are 4 GPUs (Graphics Processing Units) in use across the cluster. Each worker seems to have one GPU assigned to it, as indicated by the details in each worker's panel. |
| **Search** | The search bar allows you to quickly find specific workers, GPUs, or tasks by searching based on keywords, worker names, device IDs, or other identifiers. |
## Detailed information for each worker
| Feature | Description |
| ------------------------------------ | ----------------------------------------------------------------------------------------------------------------------------------------------------------------------- |
| Decentralized Network | IO Cloud uses a network of computers (called "IO workers") to create powerful GPU clusters. This means you're not relying on a single company for your computing power. |
| Self-healing | If one part of the cluster has issues, the others automatically take over, keeping your projects running smoothly. |
| Easy to Use | You can easily run your AI projects using Python code, just like on any other cloud platform. |
| Built on Industry-leading Technology | IO Cloud is powered by the same technology used by OpenAI to train its powerful AI models, such as GPT-3 and GPT-4. |
## Monitor the following on the left:
| Action | Definition |
| ---------------- | ------------------------------------------------------------------------------------------------------------------------------------------------------------------------------------------------------------------ |
| **All Workers** | Allows you to filter the view by selecting different groups of workers. This option is currently set to show all workers in the cluster. |
| **\[#] Workers** | Indicates that the dashboard currently shows four workers in the cluster that are active or relevant to the task being monitored. The panel below labels these workers as "IO Worker 1," "IO Worker 2," and so on. |
| **\[#] GPUs** | Shows that there are 4 GPUs (Graphics Processing Units) in use across the cluster. Each worker seems to have one GPU assigned to it, as indicated by the details in each worker's panel. |
| **Search** | The search bar allows you to quickly find specific workers, GPUs, or tasks by searching based on keywords, worker names, device IDs, or other identifiers. |
## Detailed information for each worker
| Feature | Description |
| ------------------------------------ | ----------------------------------------------------------------------------------------------------------------------------------------------------------------------- |
| Decentralized Network | IO Cloud uses a network of computers (called "IO workers") to create powerful GPU clusters. This means you're not relying on a single company for your computing power. |
| Self-healing | If one part of the cluster has issues, the others automatically take over, keeping your projects running smoothly. |
| Easy to Use | You can easily run your AI projects using Python code, just like on any other cloud platform. |
| Built on Industry-leading Technology | IO Cloud is powered by the same technology used by OpenAI to train its powerful AI models, such as GPT-3 and GPT-4. |
 ## Selecting a worker shows you the following
| Feature | Description |
| ------------------------------- | --------------------------------------------------------------------------------------------------------------------------------------------------------------------------------------------------------------------------------------------------------------------------------------------------- |
| Worker Name and Status | Indicates the worker's status, such as **Completed**, **Running**, **Pending**, or **Failed**. A green dot signifies successful completion. |
| Device ID | The unique identifier for the specific GPU device in the worker node. |
| GPU Information | **GeForce RTX 3060 Ti** (GPU type): Each worker is equipped with an NVIDIA GeForce RTX 3060 Ti GPU. **x1**: Number of GPUs utilized (in this case, one unit). **Uptime in Cluster**: Displays uptime, showing that the worker has been fully operational without downtime for the monitored period. |
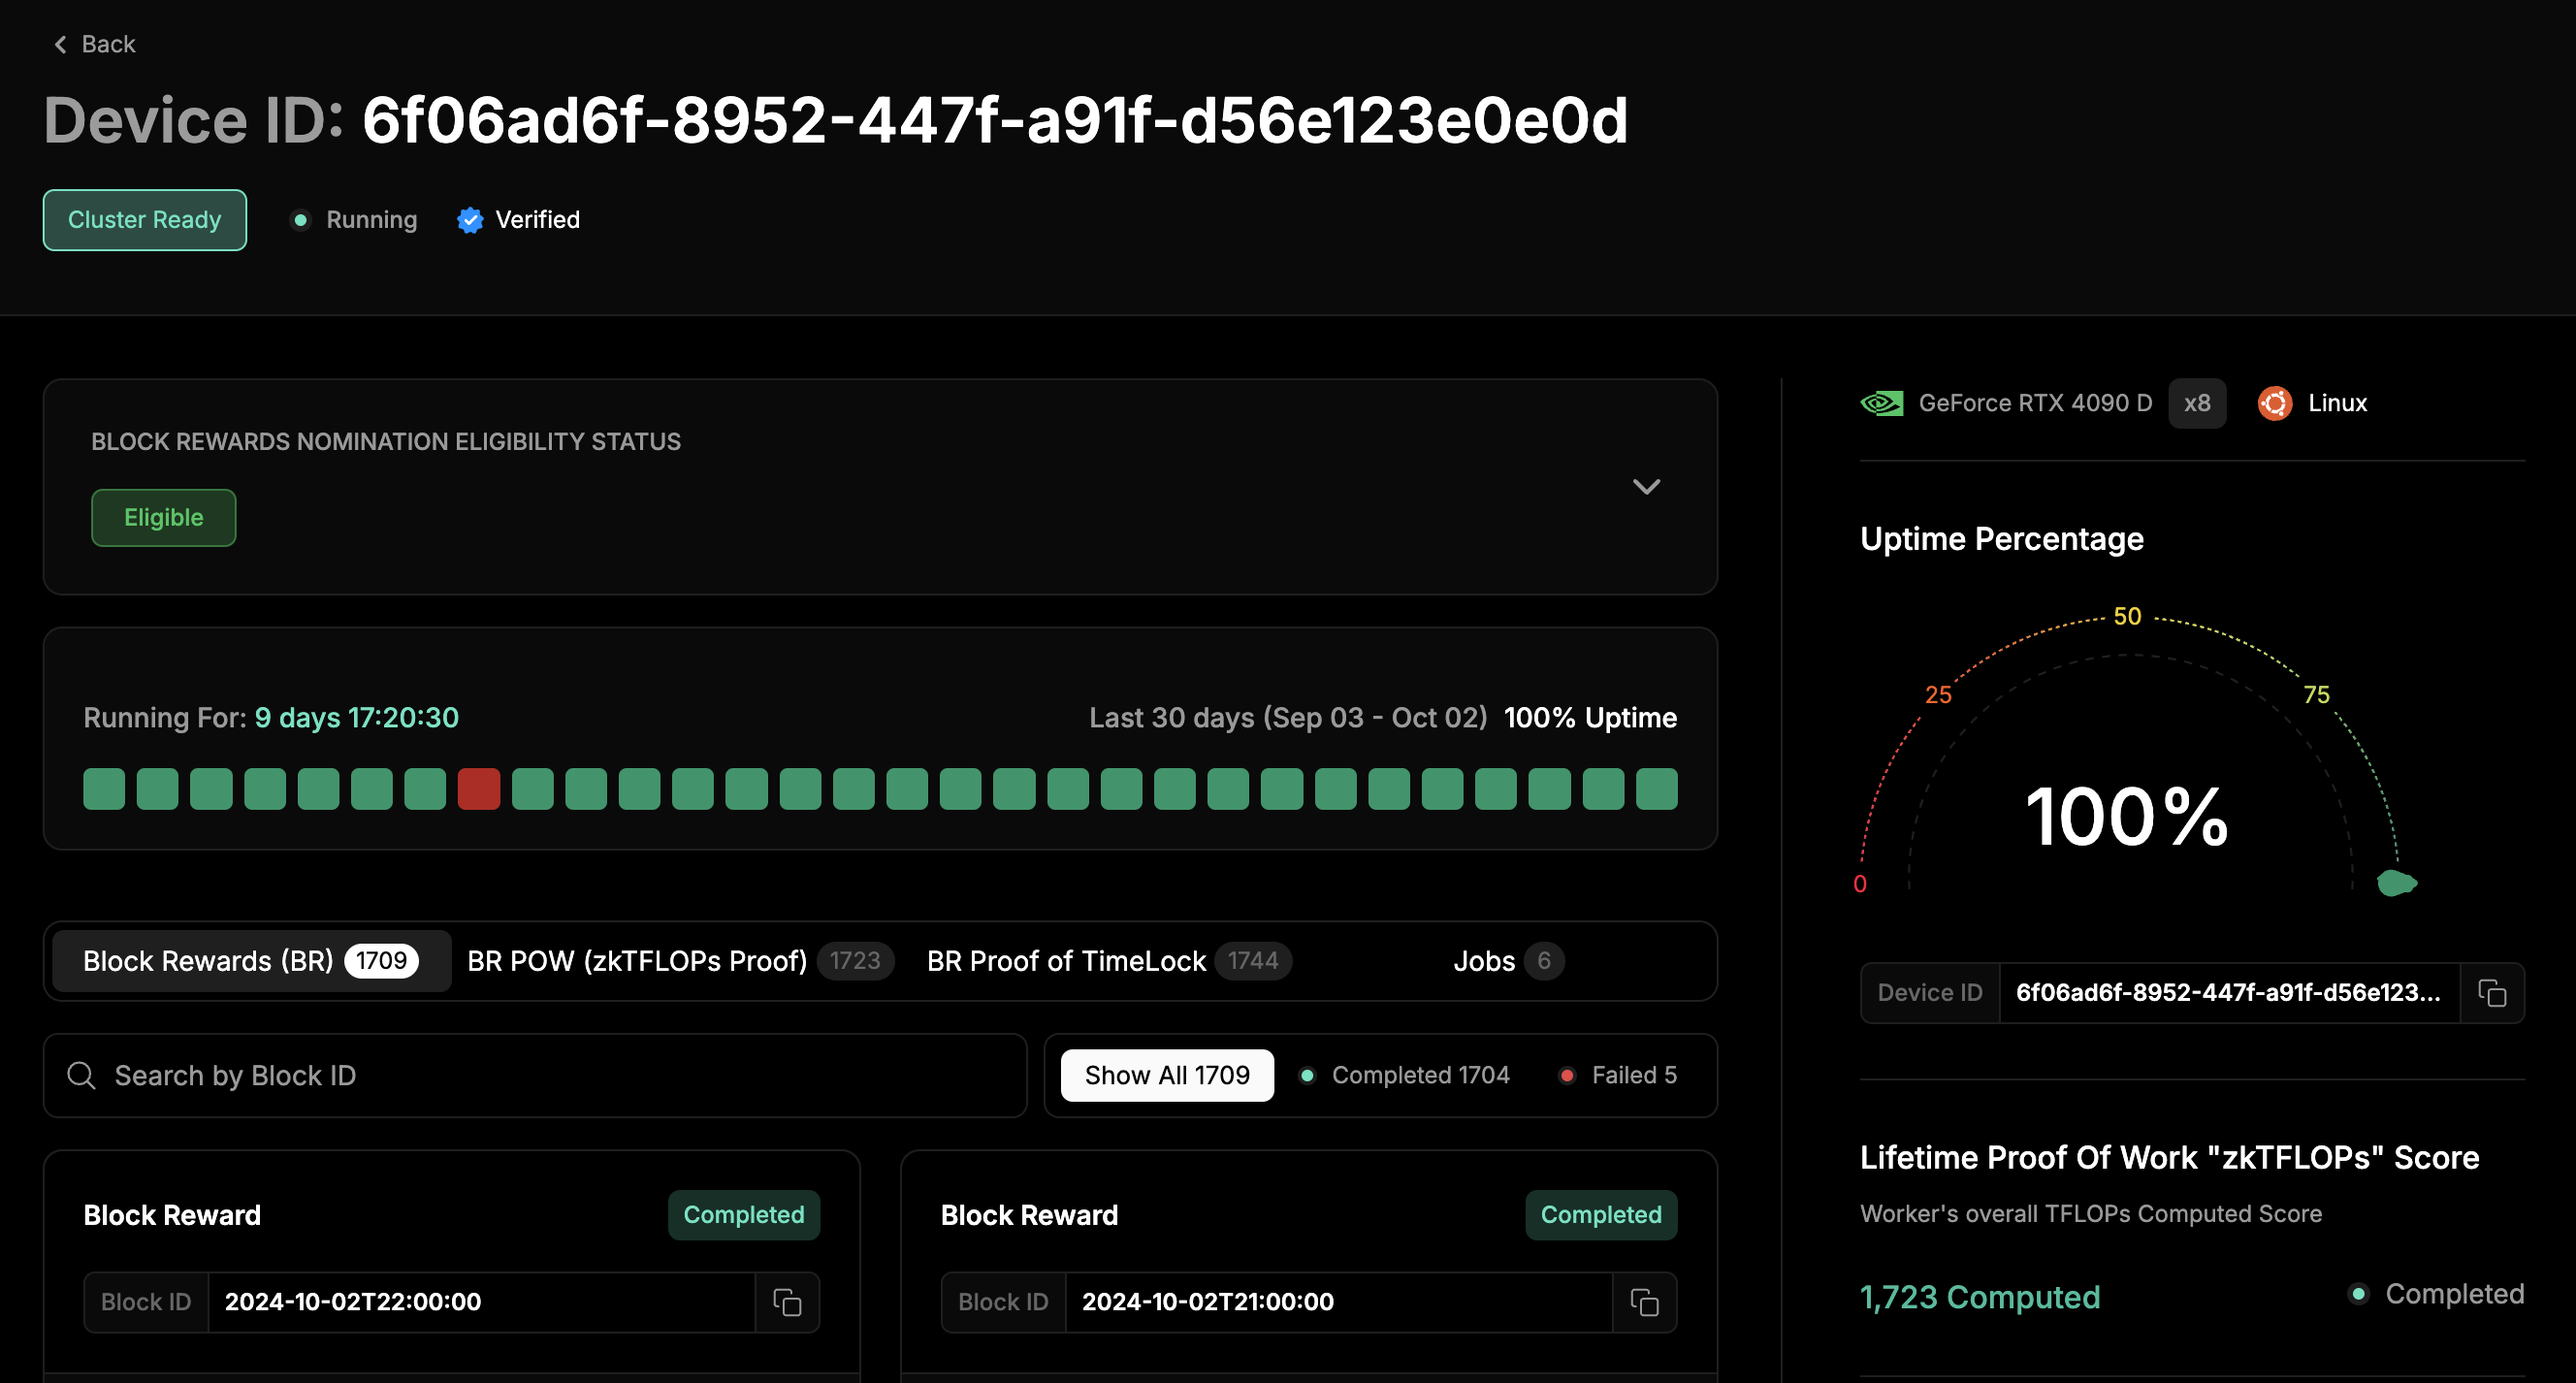
| Activity Consistency Status Bar | A visual representation of the worker’s uptime, consisting of 10 white squares filled in to indicate 100% uptime. |
## Selecting a worker shows you the following
| Feature | Description |
| ------------------------------- | --------------------------------------------------------------------------------------------------------------------------------------------------------------------------------------------------------------------------------------------------------------------------------------------------- |
| Worker Name and Status | Indicates the worker's status, such as **Completed**, **Running**, **Pending**, or **Failed**. A green dot signifies successful completion. |
| Device ID | The unique identifier for the specific GPU device in the worker node. |
| GPU Information | **GeForce RTX 3060 Ti** (GPU type): Each worker is equipped with an NVIDIA GeForce RTX 3060 Ti GPU. **x1**: Number of GPUs utilized (in this case, one unit). **Uptime in Cluster**: Displays uptime, showing that the worker has been fully operational without downtime for the monitored period. |
| Activity Consistency Status Bar | A visual representation of the worker’s uptime, consisting of 10 white squares filled in to indicate 100% uptime. |