> ## Documentation Index
> Fetch the complete documentation index at: https://io.net/docs/llms.txt
> Use this file to discover all available pages before exploring further.
# IO Tokenomics
> Tokenomics defines the structure and mechanics of a token, covering aspects like distribution, supply-demand dynamics, utility, incentives, governance, and value capture. This document provides transparency into the tokenomics of io.net.
## Key Principles
### Fixed Maximum Supply:
The total supply of \$IO is capped at 800 million coins.
* 500 million \$IO will be distributed at launch.
* The remaining 300 million \$IO will be emitted as hourly rewards to Suppliers and their Stakers over time.
### Hourly Rewards:
Rewards are distributed hourly to Suppliers and their Stakers over 20 years following a disinflationary model:
* Starts at 8% annual inflation in year 1.
* Decreases by 1.02% monthly (/\~12% per year) until the cap of 800 million \$IO is reached.
Charts detail the emission rates, annual inflation, and the distribution of emitted vs. remaining coins.
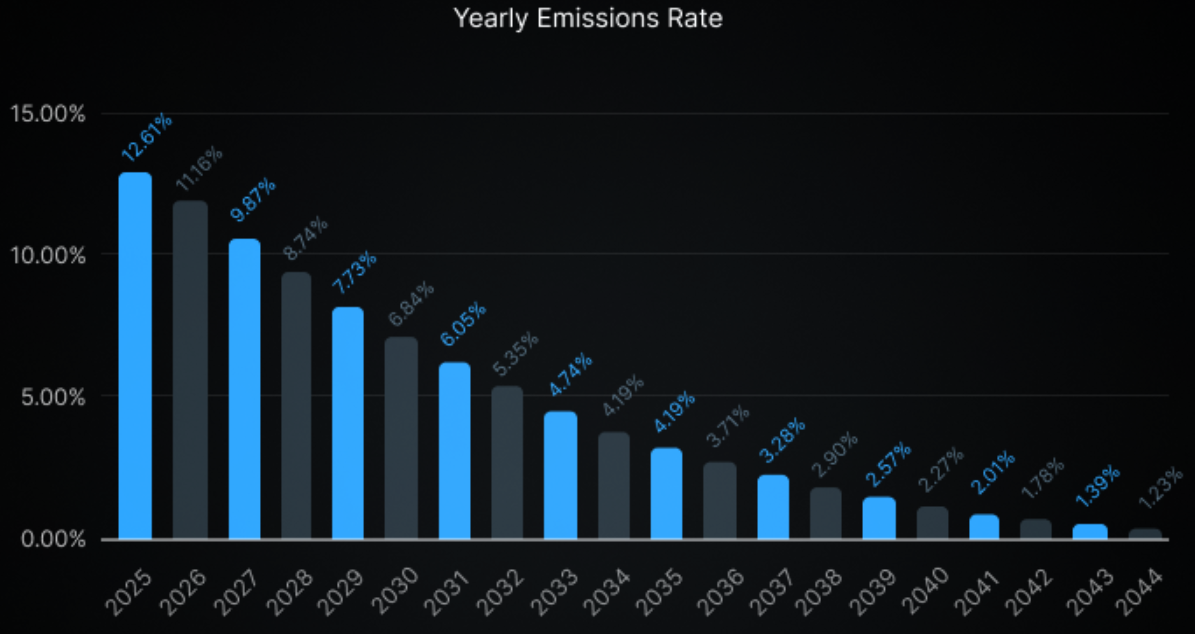 **Figure 1. Emission rate as a function of total emissions pool.**
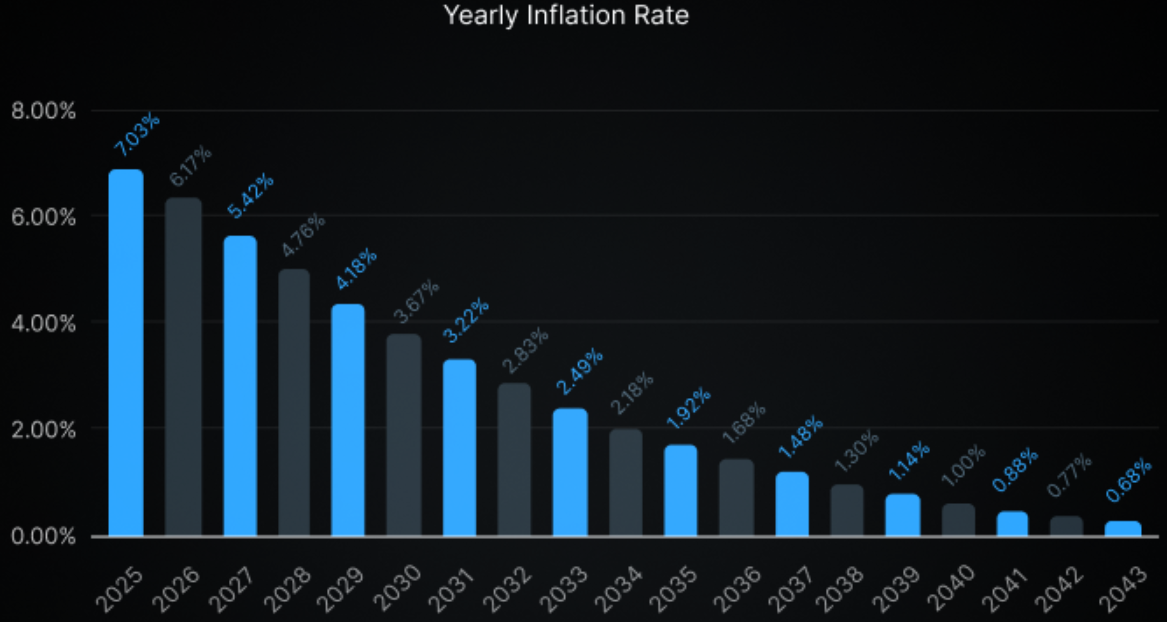 **Figure 2 Year Inflation Rate**
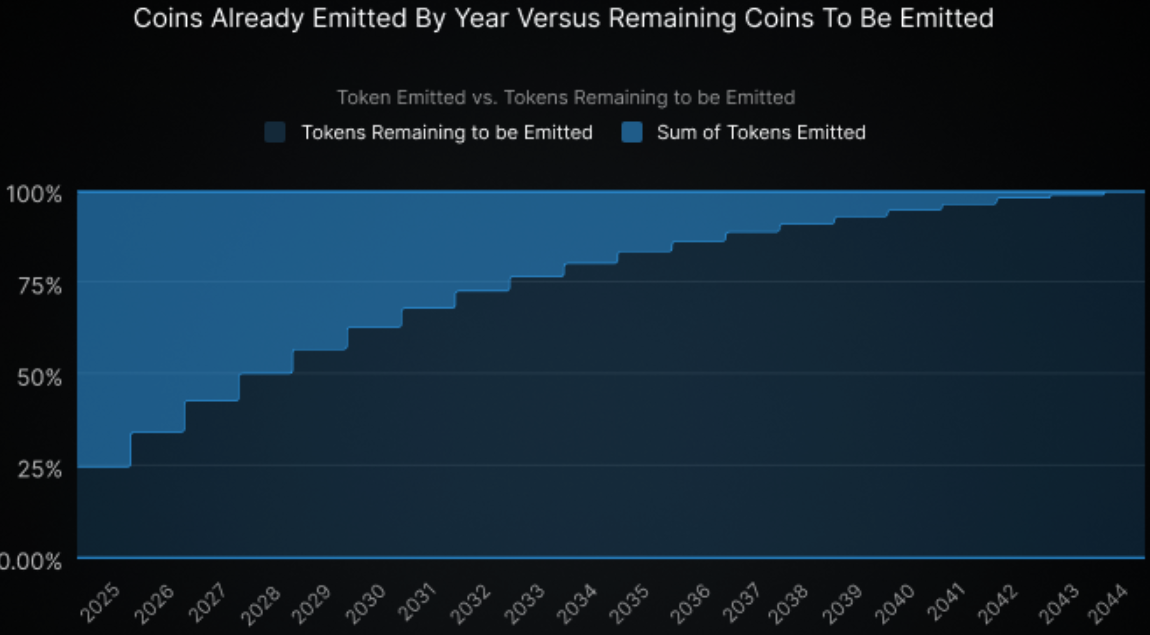 **Figure 3: Coins already emitted by year versus remaining Coins to be emitted.**
### Burn Mechanism:
\$IO employs a programmatic coin burn system:
* Revenues from the IOG Network are used to purchase and burn \$IO.
* The burn amount is adjusted dynamically based on \$IO's price, reducing supply and creating deflationary pressure.
***
## Revenue Streams and Fee Structure
io.net generates revenue through fees charged to both Users (Renters) and Suppliers:
**GPU Renter Fees**
* Reservation Fee:
* 0.25% of the total compute reservation cost is added to the Renter's cost.
* Payment Fee:
* 2% fee for payments made in 100% USDC.
* No fees for payments made in 100% \$IO.
**GPU Supplier Fees**
* Reservation Fee:
* 0.25% fee on the total reservation cost, charged to the Supplier upon payment for compute.
* Payment Fee:
* 2% fee for payments in 100% USDC.
* No fees for payments in 100% \$IO.
***
## Summary of Tokenomics Features
* **Fixed Supply:** Capped at 800 million \$IO.
* **Hourly Rewards:** Emitted to Suppliers and Stakers over 20 years with decreasing inflation.
* **Burn Mechanism:** Reduces supply via programmatic burns funded by network revenue.
These mechanisms ensure a balanced and sustainable ecosystem for \$IO.
**Figure 3: Coins already emitted by year versus remaining Coins to be emitted.**
### Burn Mechanism:
\$IO employs a programmatic coin burn system:
* Revenues from the IOG Network are used to purchase and burn \$IO.
* The burn amount is adjusted dynamically based on \$IO's price, reducing supply and creating deflationary pressure.
***
## Revenue Streams and Fee Structure
io.net generates revenue through fees charged to both Users (Renters) and Suppliers:
**GPU Renter Fees**
* Reservation Fee:
* 0.25% of the total compute reservation cost is added to the Renter's cost.
* Payment Fee:
* 2% fee for payments made in 100% USDC.
* No fees for payments made in 100% \$IO.
**GPU Supplier Fees**
* Reservation Fee:
* 0.25% fee on the total reservation cost, charged to the Supplier upon payment for compute.
* Payment Fee:
* 2% fee for payments in 100% USDC.
* No fees for payments in 100% \$IO.
***
## Summary of Tokenomics Features
* **Fixed Supply:** Capped at 800 million \$IO.
* **Hourly Rewards:** Emitted to Suppliers and Stakers over 20 years with decreasing inflation.
* **Burn Mechanism:** Reduces supply via programmatic burns funded by network revenue.
These mechanisms ensure a balanced and sustainable ecosystem for \$IO.