> ## Documentation Index
> Fetch the complete documentation index at: https://io.net/docs/llms.txt
> Use this file to discover all available pages before exploring further.
# Monthly Token Emission Schedule
> io.net proposes transitioning from an hourly to a monthly disinflation schedule while maintaining the original objective of emitting 300 million IO tokens over 20 years. This streamlined approach simplifies calculations and management while adhering to the same disinflationary principles.
io.net will release 300 million tokens over 20 years in addition to the 500 million tokens available at launch. The proposed emission schedule simplifies the frequency of disinflation from hourly to monthly while achieving the same total supply target of 800 million tokens.
* Initial Supply at Launch: 500,000,000 tokens
* Total Additional Emissions: 300,000,000 tokens over 20 years
* Final Cap: 800,000,000 tokens
* Disinflation Frequency: Monthly
* Starting Inflation Rate: 8% per year (0.667% per month)
* Disinflation Factor: /\~0.989849199 per month
* Disinflation periods: 240 (20 years × 12 months)
The monthly emission schedule follows a disinflationary curve, meaning that the inflation rate decreases over time. It starts at 8% annually and gradually reduces each month until it reaches near-zero inflation at the end of 20 years.
### Monthly Emission Schedule
The table below demonstrates the first 12 months of emissions under the proposed schedule:
| Month | Total Supply | Inflation Rate (%) | Tokens Emitted |
| -------------- | -------------- | ------------------ | -------------- |
| July 2024 | 500,000,000.00 | 0.667 | 3,333,333 |
| August 2024 | 503,335,000.00 | 0.660 | 3,299,497 |
| September 2024 | 506,658,165.73 | 0.654 | 3,266,003 |
| October 2024 | 509,969,316.47 | 0.647 | 3,232,850 |
| November 2024 | 513,268,276.00 | 0.640 | 3,200,033 |
| December 2024 | 516,554,872.59 | 0.634 | 3,167,549 |
| January 2025 | 519,828,938.94 | 0.627 | 3,135,395 |
| February 2025 | 523,090,312.18 | 0.621 | 3,103,568 |
| March 2025 | 526,338,833.81 | 0.615 | 3,072,063 |
| April 2025 | 529,574,349.69 | 0.608 | 3,040,879 |
| May 2025 | 532,796,709.99 | 0.602 | 3,010,011 |
| June 2025 | 536,005,769.19 | 0.596 | 2,979,456 |
### Visual Representation
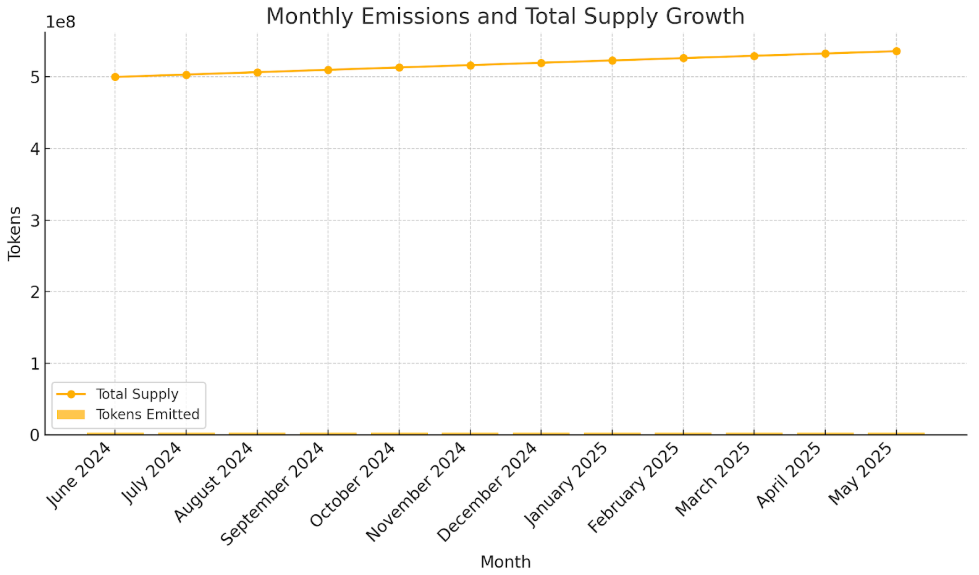
Below is a chart illustrating the total supply growth and token emissions for the first 12 months:
 ### Formula for Emissions Calculation
The formula for calculating emissions under the proposed monthly schedule is as follows:
**Emissions\_T = Total Supply\_T-1 × Inflation Rate\_T**
Where:
* Inflation Rate\_T = Inflation Rate\_T-1 × (1 - Disinflation Factor)
* Disinflation Factor ≈ 0.010150801 (or 1.01508%)
#### Initial Inflation Rate
Initial Monthly Inflation Rate = Annual Inflation Rate ÷ Months Per Year Initial Monthly Inflation Rate = 8% ÷ 12 = 0.667%
### Detailed Calculations: First Three Months
**Month 1 (July 2024):**
The first month’s emissions are based on the initial supply of 500,000,000 tokens and an inflation rate of 0.667%.
Emissions\_1 = 500,000,000 × 0.667% Emissions\_1 = 3,333,333.33 tokens
At the end of Month 1:
* Total Supply: 500,000,000 + 3,333,333.33 = 503,333,333.33
**Month 2 (August 2024):**
The disinflation factor reduces the inflation rate for Month 2:
Inflation Rate\_2 = 0.667% × (1 - 0.010150801) Inflation Rate\_2 ≈ 0.660%
The emissions for Month 2 are:
Emissions\_2 = 503,333,333.33 × 0.660% Emissions\_2 ≈ 3,299,497.40 tokens
At the end of Month 2:
* Total Supply: 503,333,333.33 + 3,299,497.40 = 506,632,830.73
**Month 3 (September 2024):**
The inflation rate for Month 3 is further reduced:
Inflation Rate\_3 = 0.660% × (1 - 0.010150801) Inflation Rate\_3 ≈ 0.654%
The emissions for Month 3 are:
Emissions\_3 = 506,632,830.73 × 0.654% Emissions\_3 ≈ 3,266,003.20 tokens
At the end of Month 3:
* Total Supply: 506,632,830.73 + 3,266,003.20 = 509,898,833.93
### Conclusion
The proposed monthly schedule achieves the same emission goal of 300 million tokens over 20 years but simplifies management and calculations compared to the current hourly schedule. By transitioning to monthly emissions:
1. Simplification: Reduces emission frequency from 175,319 hourly epochs to 240 monthly epochs.
2. Accuracy: Maintains the same cumulative disinflation effect over 20 years.
3. Ease of Implementation: Aligns better with monthly financial and operational reporting cycles.
### Formula for Emissions Calculation
The formula for calculating emissions under the proposed monthly schedule is as follows:
**Emissions\_T = Total Supply\_T-1 × Inflation Rate\_T**
Where:
* Inflation Rate\_T = Inflation Rate\_T-1 × (1 - Disinflation Factor)
* Disinflation Factor ≈ 0.010150801 (or 1.01508%)
#### Initial Inflation Rate
Initial Monthly Inflation Rate = Annual Inflation Rate ÷ Months Per Year Initial Monthly Inflation Rate = 8% ÷ 12 = 0.667%
### Detailed Calculations: First Three Months
**Month 1 (July 2024):**
The first month’s emissions are based on the initial supply of 500,000,000 tokens and an inflation rate of 0.667%.
Emissions\_1 = 500,000,000 × 0.667% Emissions\_1 = 3,333,333.33 tokens
At the end of Month 1:
* Total Supply: 500,000,000 + 3,333,333.33 = 503,333,333.33
**Month 2 (August 2024):**
The disinflation factor reduces the inflation rate for Month 2:
Inflation Rate\_2 = 0.667% × (1 - 0.010150801) Inflation Rate\_2 ≈ 0.660%
The emissions for Month 2 are:
Emissions\_2 = 503,333,333.33 × 0.660% Emissions\_2 ≈ 3,299,497.40 tokens
At the end of Month 2:
* Total Supply: 503,333,333.33 + 3,299,497.40 = 506,632,830.73
**Month 3 (September 2024):**
The inflation rate for Month 3 is further reduced:
Inflation Rate\_3 = 0.660% × (1 - 0.010150801) Inflation Rate\_3 ≈ 0.654%
The emissions for Month 3 are:
Emissions\_3 = 506,632,830.73 × 0.654% Emissions\_3 ≈ 3,266,003.20 tokens
At the end of Month 3:
* Total Supply: 506,632,830.73 + 3,266,003.20 = 509,898,833.93
### Conclusion
The proposed monthly schedule achieves the same emission goal of 300 million tokens over 20 years but simplifies management and calculations compared to the current hourly schedule. By transitioning to monthly emissions:
1. Simplification: Reduces emission frequency from 175,319 hourly epochs to 240 monthly epochs.
2. Accuracy: Maintains the same cumulative disinflation effect over 20 years.
3. Ease of Implementation: Aligns better with monthly financial and operational reporting cycles.