> ## Documentation Index
> Fetch the complete documentation index at: https://io.net/docs/llms.txt
> Use this file to discover all available pages before exploring further.
# Workers
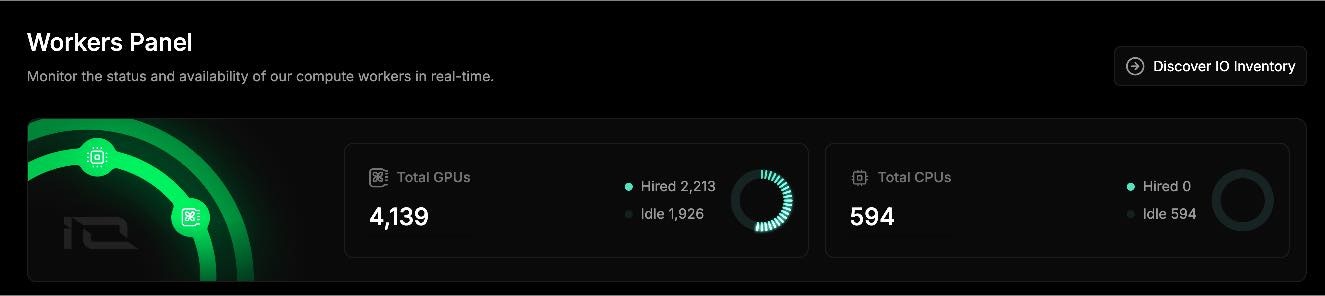
> The Workers tab provides a public overview of all devices connected to the network, along with real-time metrics on active hires. This allows users to gain valuable insights into the current network status and the demand for computing power.
**Key Metrics Displayed:**
* **Total GPUs** (hired and idle)
* **Total CPUs** (hired and idle)
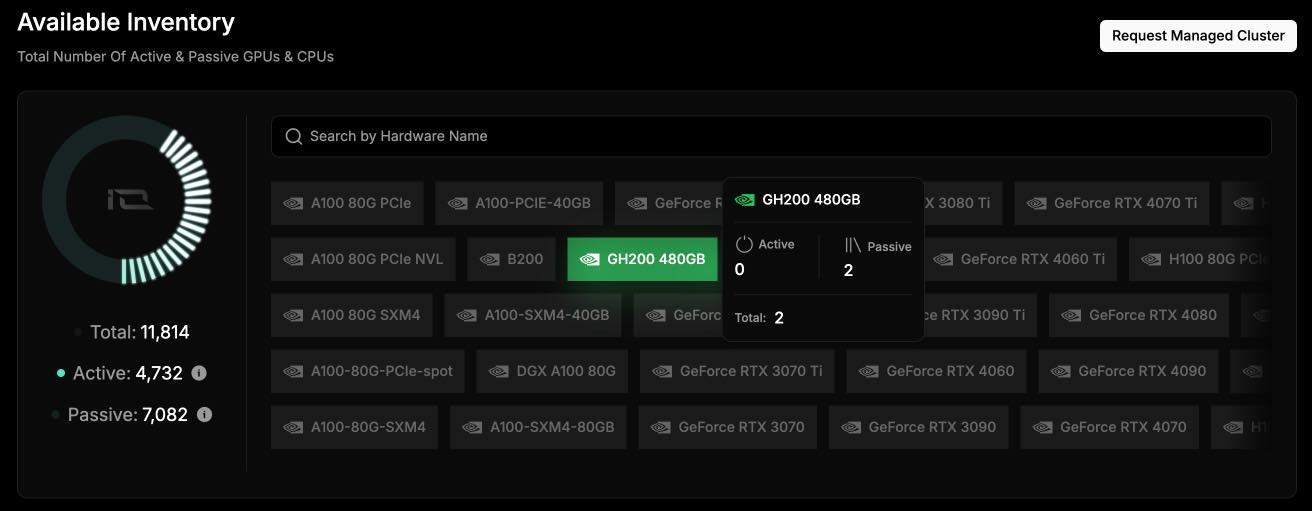
 ### Available Inventory
The Workers tab also highlights **available inventory**, which includes both active and passive GPU and CPU processors. You can click on a specific processor to view detailed statistics about its usage and performance.
### Available Inventory
The Workers tab also highlights **available inventory**, which includes both active and passive GPU and CPU processors. You can click on a specific processor to view detailed statistics about its usage and performance.
 ## Workers List
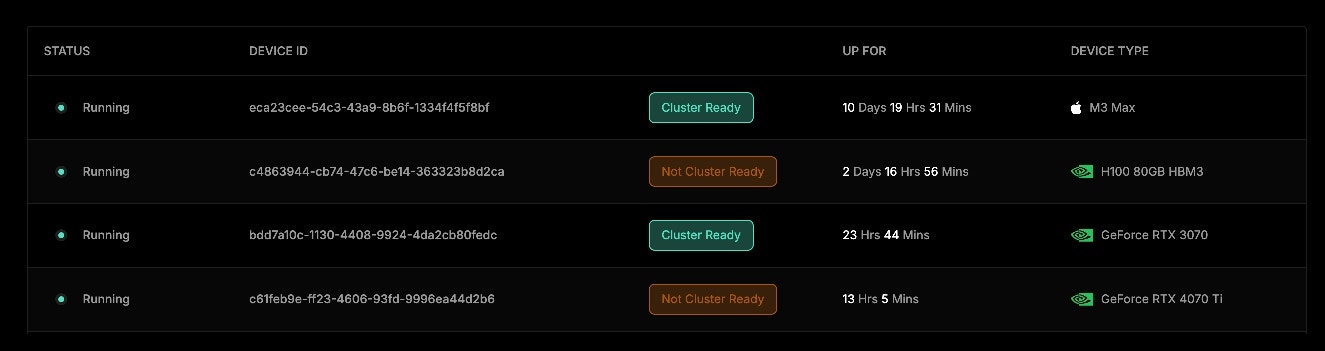
The Workers List provides a transparent, real-time view of all connected devices, along with their current operational status and hire activity.
**The table includes:**
* **Worker Status** (active, idle, or under maintenance)
* **Link to View Worker Details** (for in-depth metrics)
* **Hire Status** (availability for compute tasks)
* **Uptime Duration** (how long the worker has been active)
* **Device Types & Quantities** (detailed breakdown within each cluster)
## Workers List
The Workers List provides a transparent, real-time view of all connected devices, along with their current operational status and hire activity.
**The table includes:**
* **Worker Status** (active, idle, or under maintenance)
* **Link to View Worker Details** (for in-depth metrics)
* **Hire Status** (availability for compute tasks)
* **Uptime Duration** (how long the worker has been active)
* **Device Types & Quantities** (detailed breakdown within each cluster)
 ## Worker Details
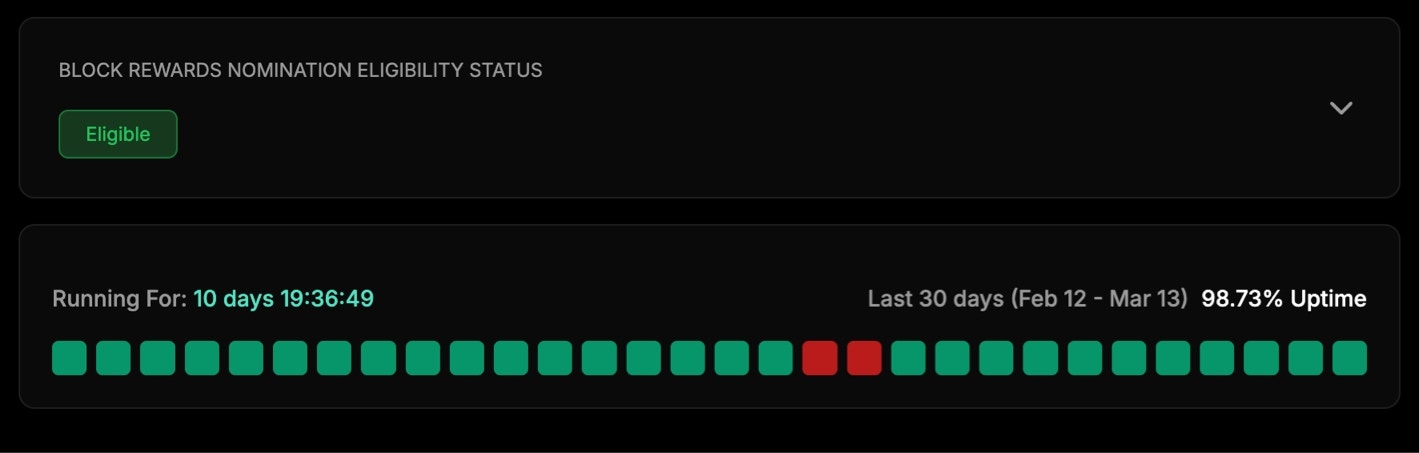
Users can access a detailed view of each **Device** by selecting it from the **Workers List**. The details for each device includes full specifications, utilization metrics, and a breakdown of worker performance.
### Device Overview Includes:
At the top of the Device Overview, users can view:
* **Block Rewards Nomination Eligibility Status**
* Default view shows only pass/fail status for each category.
* Users can expand the section to see detailed criteria for Block Rewards Nominations.
* **Uptime Graph for the Last 30 Days**
* Easily track whether the device has experienced downtime or remained continuously active.
## Worker Details
Users can access a detailed view of each **Device** by selecting it from the **Workers List**. The details for each device includes full specifications, utilization metrics, and a breakdown of worker performance.
### Device Overview Includes:
At the top of the Device Overview, users can view:
* **Block Rewards Nomination Eligibility Status**
* Default view shows only pass/fail status for each category.
* Users can expand the section to see detailed criteria for Block Rewards Nominations.
* **Uptime Graph for the Last 30 Days**
* Easily track whether the device has experienced downtime or remained continuously active.
 ### Main Metrics Displayed:
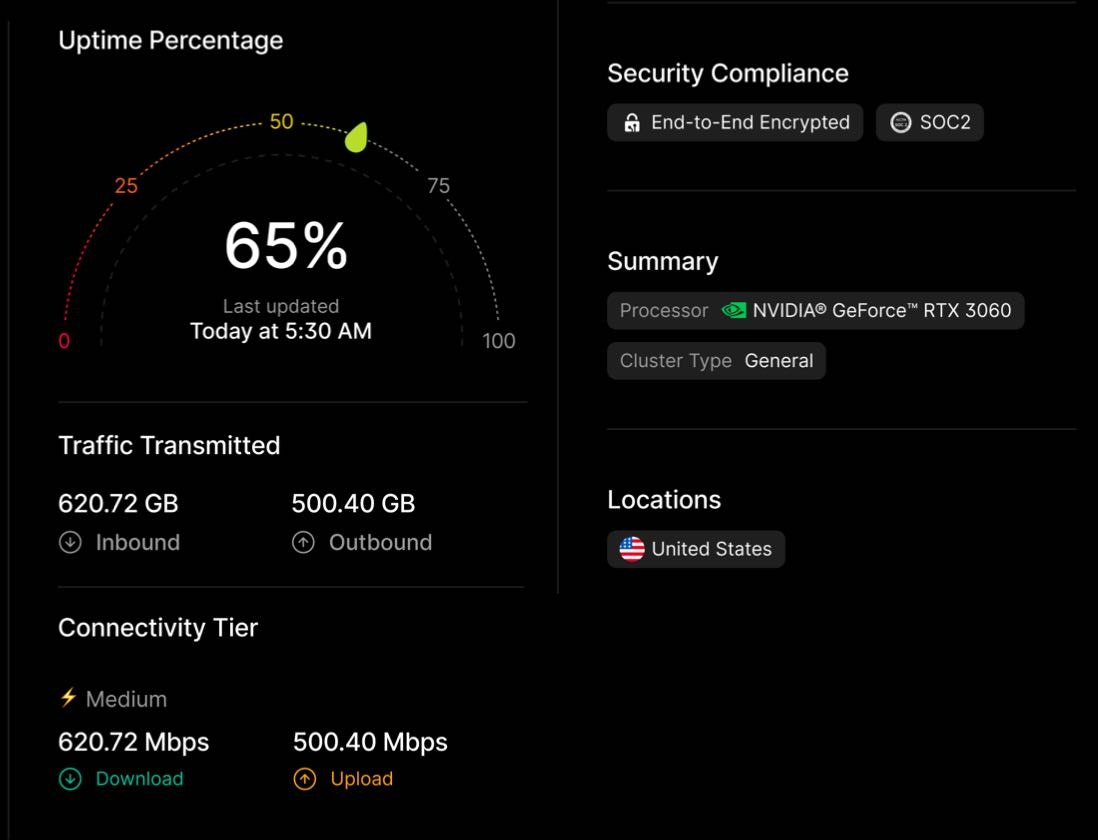
On the right-hand side of the page, users can find key performance indicators for the selected device:
* **Uptime Percentage** (availability over time)
* **Traffic Transmitted** (data usage and throughput)
* **Connectivity Tier** (network performance classification)
* **Security Compliance** (status of security protocols)
* **Location** (geographic placement of the device)
**Running Services:**
* **IO Version Control Status** (software version management)
* **IO Monitor Status** (device health monitoring)
* **Ray.io Status** (distributed computing framework status)
This **Device Overview** enables users to efficiently track, manage, and assess decentralized compute resources in real-time.
### Main Metrics Displayed:
On the right-hand side of the page, users can find key performance indicators for the selected device:
* **Uptime Percentage** (availability over time)
* **Traffic Transmitted** (data usage and throughput)
* **Connectivity Tier** (network performance classification)
* **Security Compliance** (status of security protocols)
* **Location** (geographic placement of the device)
**Running Services:**
* **IO Version Control Status** (software version management)
* **IO Monitor Status** (device health monitoring)
* **Ray.io Status** (distributed computing framework status)
This **Device Overview** enables users to efficiently track, manage, and assess decentralized compute resources in real-time.
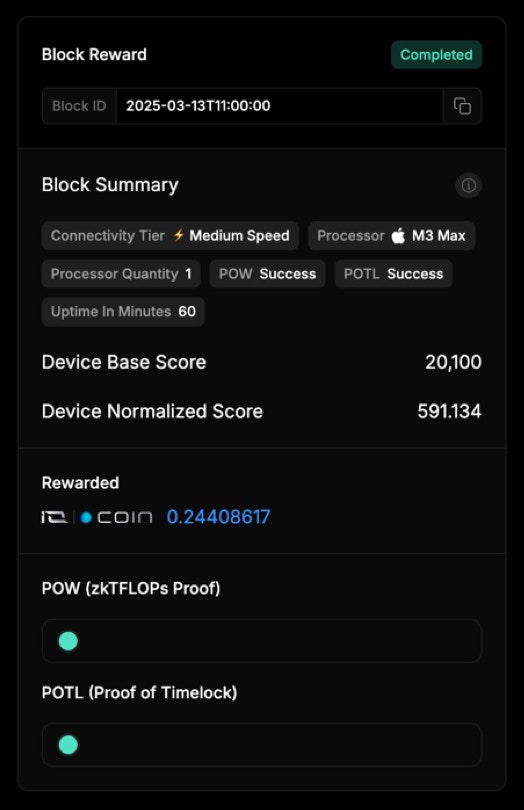
 **Block Rewards:**
The **Block Rewards** tab provides detailed information about all of the Block Rewards associated with a specific device, this includes:
| Block | Description |
| ------------------ | ------------------------------------------------------------------------------------------------------------------------------------------------------------------------------------ |
| Block Reward | To the right of Block Reward, you see the status. In this instance, it's **Completed**. If the device fails to satisfy the POW and POTL requirements, **Failed** will appear. |
| Block ID | A unique identifier assigned to each block within a blockchain. |
| Connectivity Tier | The Connectivity Tier that the worker qualifies for. This is an option when a customer reserves a GPU/CPU when they deploy a cluster. |
| Processor | The processor type, GPU/CPU. In this example, it's a Nvidia L4 GPU. |
| Processor Quantity | Number of processors available for the worker. |
| POTL | (Proof of Timelock) - Verifies the uptime for the worker. This can be executed against a hired worker. |
| POW | (zkTFLOPs Proof) Tasks the worker must solve to verify the worker. To learn more about POW, see [Proof of Work](/docs/proof-of-work). This is never executed against a hired worker. |
| Device Base Score | This score is based on hardware quantity, hardware multiplier, and the connectivity tier. |
See below for the base score calculation:
```
+ (0.02 x (connectivity_tier_number" / 4.0))
+ (2.0 x "hardware_multiplier" x "processor_quantity") ) x 100 + (0.05 x "was_hired")) x 10
```
The formula above is subject to future change by the IOG foundation. For example, a significant increase for the weight of hired status in the overall base score calculation. This would incentivize practical and usable GPU device growth within the IO ecosystem.
**Device Normalized Score**- This score represents potential earnings for the device, which is based on the available coin emissions for the block and the scores of all eligible devices.
The calculation is designed to ensure that the total GPU Normalized Score is 8M, and Total CPU Normalized Score is 2M. **Device Normalised Score** is calculated as **Device Base Score** / **Total Base Score** of **Device Type** / **Normalized Score** allocation.
For example, if a GPU Device Base Score is 8150, the total GPU device score at that hour across the entire network is 115M, then the GPU Device Normalized Score is 569. (8150/115Mx8M).
**Rewarded**- The amount of IO Coin the worker earned based on **Total Score**.
**Block Rewards:**
The **Block Rewards** tab provides detailed information about all of the Block Rewards associated with a specific device, this includes:
| Block | Description |
| ------------------ | ------------------------------------------------------------------------------------------------------------------------------------------------------------------------------------ |
| Block Reward | To the right of Block Reward, you see the status. In this instance, it's **Completed**. If the device fails to satisfy the POW and POTL requirements, **Failed** will appear. |
| Block ID | A unique identifier assigned to each block within a blockchain. |
| Connectivity Tier | The Connectivity Tier that the worker qualifies for. This is an option when a customer reserves a GPU/CPU when they deploy a cluster. |
| Processor | The processor type, GPU/CPU. In this example, it's a Nvidia L4 GPU. |
| Processor Quantity | Number of processors available for the worker. |
| POTL | (Proof of Timelock) - Verifies the uptime for the worker. This can be executed against a hired worker. |
| POW | (zkTFLOPs Proof) Tasks the worker must solve to verify the worker. To learn more about POW, see [Proof of Work](/docs/proof-of-work). This is never executed against a hired worker. |
| Device Base Score | This score is based on hardware quantity, hardware multiplier, and the connectivity tier. |
See below for the base score calculation:
```
+ (0.02 x (connectivity_tier_number" / 4.0))
+ (2.0 x "hardware_multiplier" x "processor_quantity") ) x 100 + (0.05 x "was_hired")) x 10
```
The formula above is subject to future change by the IOG foundation. For example, a significant increase for the weight of hired status in the overall base score calculation. This would incentivize practical and usable GPU device growth within the IO ecosystem.
**Device Normalized Score**- This score represents potential earnings for the device, which is based on the available coin emissions for the block and the scores of all eligible devices.
The calculation is designed to ensure that the total GPU Normalized Score is 8M, and Total CPU Normalized Score is 2M. **Device Normalised Score** is calculated as **Device Base Score** / **Total Base Score** of **Device Type** / **Normalized Score** allocation.
For example, if a GPU Device Base Score is 8150, the total GPU device score at that hour across the entire network is 115M, then the GPU Device Normalized Score is 569. (8150/115Mx8M).
**Rewarded**- The amount of IO Coin the worker earned based on **Total Score**.